
The Story of Declining Epidemic Death Tolls
Looking into the decline of death tolls in recorded epidemic events over the past 450 years.
Intro
I’m in my senior year of the statistics program here at BYU and I will be attending a Masters program in biostatistics next fall. Epidemiology, or the study of diseases, has always intrigued me and so for this project I decided to look into epidemic events through out history. I webscraped and cleaned a dataset of epidemics from Wikipedia, which I explain in great detail at my post here: https://robbysainsbury.github.io/stat386-projects/2022/10/21/Epidemic-Events-Through-Out-History.html . I then explored the data and found that the data was very messy. Fortunately, I was able to get decent data for epidemic events over the last 450+ years. This proccess can be seen at my blog post here: https://robbysainsbury.github.io/stat386-projects/2022/11/18/EDA-on-Epidemic-Events-Data.html Anything farther back then that doesn’t have estimates for death tolls. Today I will be talking an interesting pattern I found in the data.
Data Story
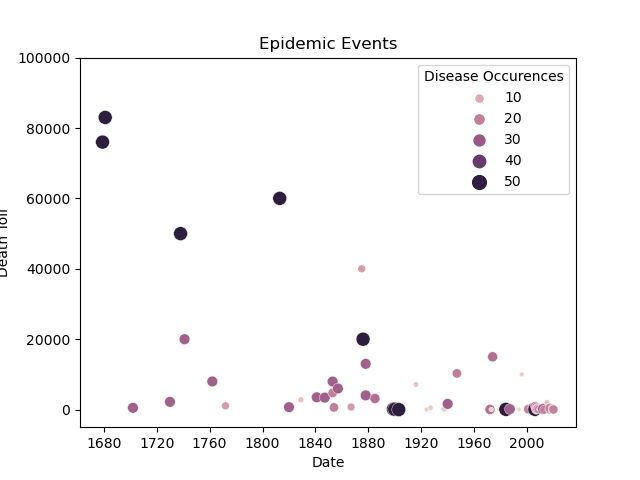
As you can see in the figure, over the past 450+ years there appears to be a decline in death tolls from epidemic events. The extreme events become rarer and less extreme as you near the modern day. It is also worth noting that the diseases that are responsible for the most epidemic events are often responsible for the most severe death tolls. This is interesting because a disease performs best when it’s host survives long enough to transmit to other people. These diseases that appear the most on this list are very unique in the sense that they both exhibit lasting impacts over 100s of years and very high death tolls. With all that in mind, it seems that as modern medicine, sanitation, and public health have improved, both the severity and frequency of extreme events has decreased.
Conclusion
I have enjoyed working with this data set and learning more about a field that interests me. I think it is amazing that the power of data exploration and visualization allows this single figure to tell a story of declining death tolls from epidemic events.
The code for this project, including the scraping, cleaning, and exploration of the data can be found at my Github page at this link: