
Epidemic Events Through Out History
A simple walkthrough of how to get data from the web, using epidemioligical data as an example.
Intro
I’m in my senior year of the statistics program here at BYU and that means I have to start thinking aboutt my future. I’m looking at which grad programs to apply to and I’ve settled on applying to a few biostatistcs programs spread out through out the US. Epidemiology, or the study of diseases, has always intrigued me and so for this project I decided to look more into that while practicing my web scraping skills.
Methods
I wanted to find a data set of all the epidemics through out history. After a little searching online, I found one on Wikipedia at [https://en.wikipedia.org/wiki/List_of_epidemics]. This data set contains a list of epidemic and pandemic events through out history and has details like the date, location, disease, and death toll. I made sure to check if it was ethically ok to web scrape and use this data by looking through Wikipedias’s policy. I cited the site’s url above as well as in the read me for my code repository and did not see anything specific to this page that differs from the overall policy.
In order to get it to a state where I could use and analyze, I used the pandas library in Python. Below I’ll brifely go over the code I used to read it from the web into a data frame object, and then to save it as csv file.
import pandas as pd
I started off by importing the pandas library, which will allow me to read in and manipulate the data.
url = "https://en.wikipedia.org/wiki/List_of_epidemics"
dfs = pd.read_html(url)
The function read_html will return a list of all the html lists on the web page.
len(dfs)
dfs[1]
Now its just a matter of shifting through the list to find the table I need, in this case it was the second table tag on the web page (I used a one while indexing the list because the index starts at 0).
epidemics = dfs[1]
epidemics.to_csv("epidemics.csv")
Finally, I set up an object of just the dataframe I want and export it as a csv for future use.
The full code I used can be found at: [https://github.com/robbysainsbury/codeForWebScrapingBlogPost]
Conclusion
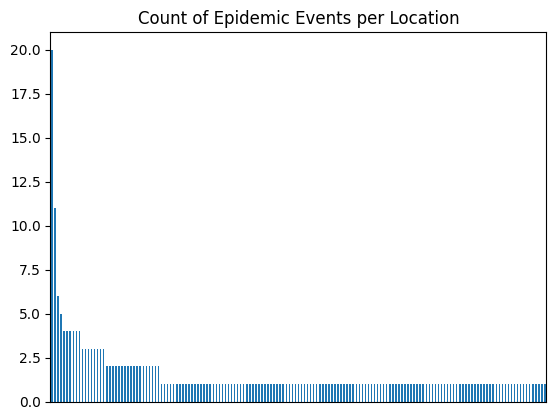
This is just a little teaser for the exploratory analysis I’m excited to do on this data set! I want to look at the death toll of these diseases throughout time and whether their location impacts that as well! My next post will be all about that EDA.